Mid-Atlantic Division
Cancer Diagnosis Program (CDP) Breast Cancer Progression Tissue Microarray
Design Overview
The CDP breast cancer progression TMA, constructed from case sets 3 through 8, provides high statistical power for comparisons of marker prevalence across breast cancer cases that are node-negative at diagnosis, node-positive but not metastatic at diagnosis or metastatic at diagnosis. The DCIS and normal breast tissue cores on the breast cancer progression TMA are 1.5 mm in diameter, and the remaining cores on the TMA are 0.6 mm in diameter. To construct this tissue microarray the CDP selected a collection of 679 breast tissue specimens which was divided into six non-overlapping case sets, Case Sets 3-8, each representing between 112-115 breast tissue specimens. The table below gives the distribution of breast tissue and control samples across the 6 case sets. Because of the large number of cores included in the design, it was not possible to place all the cores required for an experiment into a single paraffin array block; instead, three blocks were required. Thus each complete array set requires the assembly of sections from three case sets. Each of the six case sets was arrayed in quadruplicate to address possible tissue heterogeneity. For example, four cores were taken from each of the 115 breast tissue specimens in case set 4 and from the 18 control specimens to develop 4 replicate TMA blocks that each contains 133 cores. The same process was then used to construct quadruplicate TMA blocks for the other five case sets. At this time only sections from Case Sets 4, 6 and 8 are being distributed. The design is such that for a request to be filled using the breast cancer progression TMA, successful applicants are required to accept a minimum of two sections (from different replicate blocks) from each of the three different case sets, for a total of 6 sections (3 case sets x 2 replicate sections from different TMA blocks.) Sections are currently cut and distributed from the blocks constructed from case sets 4, 6 and 8, which together comprise a complete array set.
TMA Map
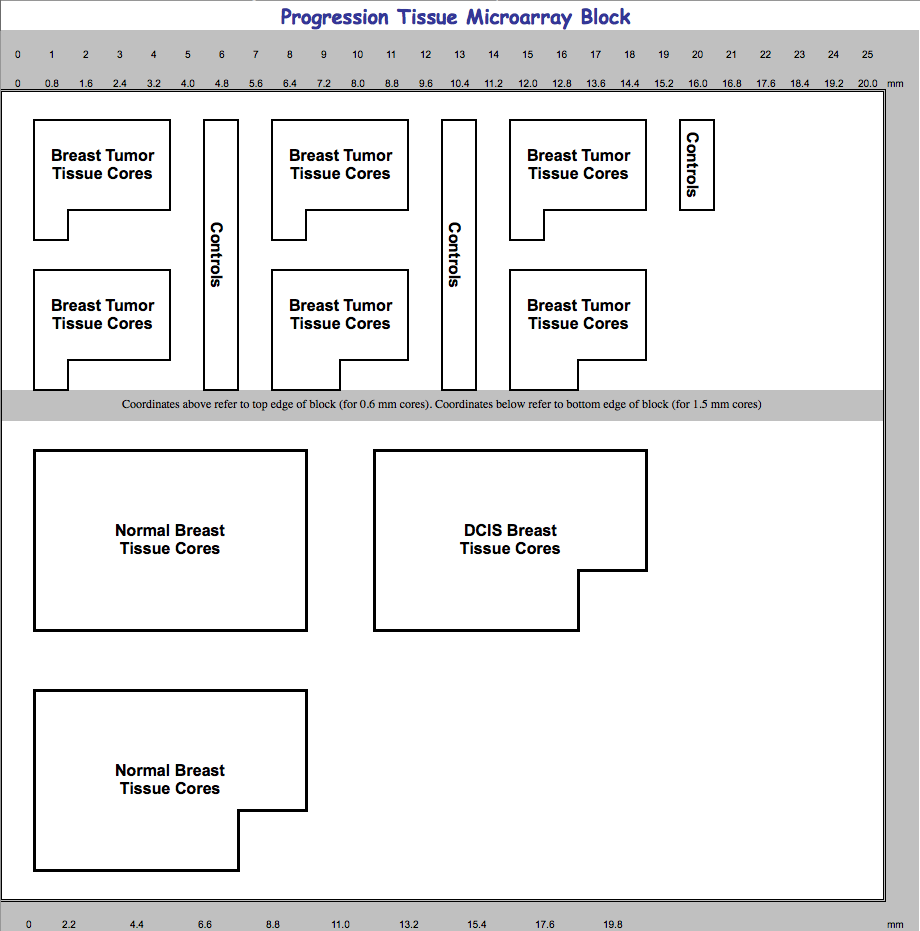
Breast Progression TMA Tissue List
Specimens represented in the CDP 2008 Series Stage I Progression TMA case sets. Each case set is used to produce quadruplicate TMA blocks, so numbers presented in table should be multiplied by four to obtain the number of cores required for the full Stage I TMA set.
| Type of Case | Case Set 4 | Case Set 6 | Case Set 8 | Total |
|---|---|---|---|---|
| Node-negative cases | 28 | 28 | 26 | 82 |
| Node-positive cases | 26 | 27 | 27 | 80 |
| Metastatic cases | 27 | 26 | 27 | 80 |
| Ductal carcinoms in-situ (DCIS) cases | 11 | 8 | 10 | 29 |
| Normal breast cases | 23 | 23 | 23 | 69 |
| Total distinct breast tissue specimens | 115 | 112 | 113 | 340 |
|
Cell line controls |
||||
|
HT-29 |
2 | 2 | 2 | 6 |
|
PC-3 |
2 | 2 | 2 | 6 |
|
MCF-7 |
2 | 2 | 2 | 6 |
|
T-47D |
2 | 2 | 2 | 6 |
|
MCF-10A |
2 | 2 | 2 | 6 |
|
Normal non-breast tissue controls |
||||
|
Kidney |
2 | 2 | 2 | 6 |
|
Endometrium |
2 | 2 | 2 | 6 |
|
Colon |
2 | 2 | 2 | 6 |
|
Prostate |
2 | 2 | 2 | 6 |
| Total control cores per replicate TMA block | 18 | 18 | 18 | 54 |
| Grand total cores per replicate TMA block | 133 | 130 | 131 | 394 |
| These numbers represent the number of cases selected in the original design of the TMA. Due to the non-uniformity inherent to tissue samples and histologic techniques, not all cases will be represented in all of the TMA sections. | ||||
Annotation Data
View and Download TMA Data (Annotation Tables, Maps, Data Key)