Mid-Atlantic Division
Cancer Diagnosis Program (CDP) Breast Cancer Stage I Prognostic TMA
Design Overview
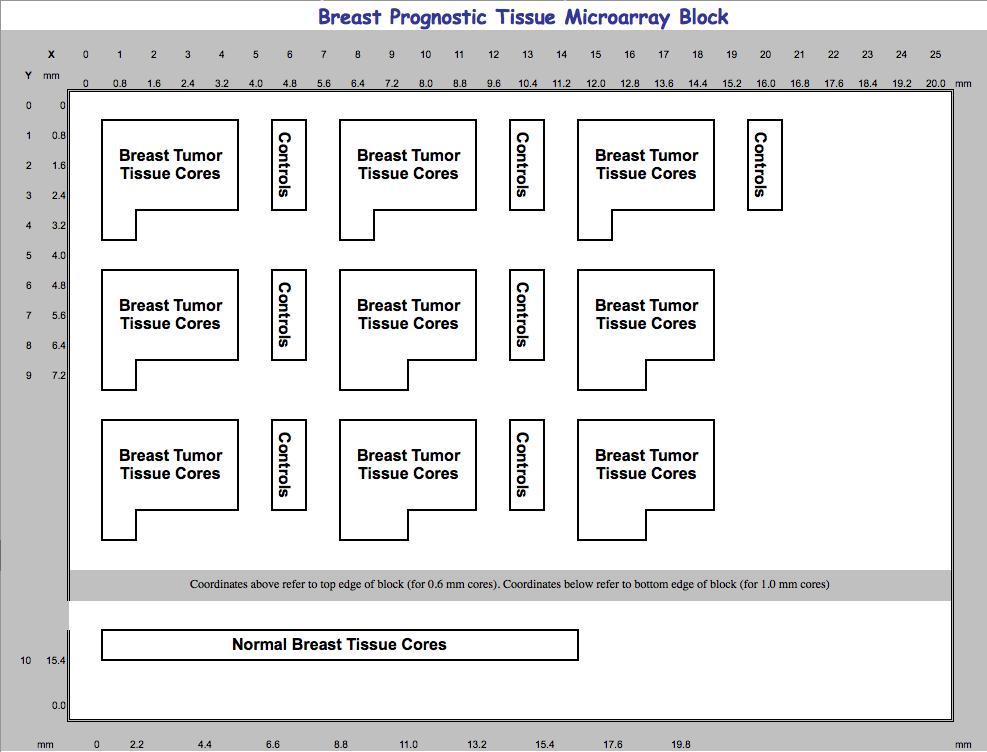
The CDP 2008 Series Stage I Prognostic TMA represents a collection of 590 stage I invasive breast cancer tissue specimens with associated clinico-pathologic data and clinical follow-up information. These cases are divided into five non-overlapping case sets. The case sets are labeled case sets 9-13 to distinguish them from case sets used on previous TMAs. Each case set is arrayed in quadruplicate, producing a total of 20 TMA blocks. The table below gives the distribution of breast tissue and control samples across the 5 case sets. The number of cores represented on any single TMA section is 146 (126 breast tissue cores + 20 control cores). Normal breast epithelium cores will be 1.0 mm and all other cores will be 0.6 mm in diameter. An applicant whose request for the Stage I Prognostic TMA is approved would be required to accept TMAs from all five case sets, with a minimum of two sections (from different replicate blocks) from each case set. Thus, the minimum number of TMA sections that any investigator would receive is ten (5 case sets √ó 2 replicate TMA blocks per case set √ó 1 section per TMA block).
TMA Map
Breast Stage I Prognostic TMA Tissue List
Specimens represented in the CDP 2008 Series Stage I Prognostic TMA case sets. Each case set is used to produce quadruplicate TMA blocks, so numbers presented in table should be multiplied by four to obtain the number of cores required for the full Stage I TMA set.
| Type of Case | Case Set 9 | Case Set 10 | Case Set 11 | Case Set 12 | Case Set 13 | Total |
|---|---|---|---|---|---|---|
| Stage I invasive breast carcinoma | 118 | 118 | 118 | 118 | 118 | 590 |
| Normal breast epithelium | 5 | 5 | 5 | 5 | 5 | 25 |
| Breast fibroadenoma | 3 | 3 | 3 | 3 | 3 | 15 |
| Total distinct breast tissue specimens | 126 | 126 | 126 | 126 | 126 | 630 |
|
Cell line controls |
||||||
|
MCF-7 |
2 | 2 | 2 | 2 | 2 | 10 |
|
MCF-10A |
2 | 2 | 2 | 2 | 2 | 10 |
|
SK-BR-3 |
2 | 2 | 2 | 2 | 2 | 10 |
|
SK-OV-3 |
2 | 2 | 2 | 2 | 2 | 10 |
|
T-47D |
2 | 2 | 2 | 2 | 2 | 10 |
|
Normal non-breast tissue controls |
||||||
|
Salivary gland |
2 | 2 | 2 | 2 | 2 | 10 |
|
Endometrium |
2 | 2 | 2 | 2 | 2 | 10 |
|
Colon |
2 | 2 | 2 | 2 | 2 | 10 |
|
Tonsil |
2 | 2 | 2 | 2 | 2 | 10 |
|
Prostate |
2 | 2 | 2 | 2 | 2 | 10 |
| Total controls cores per replicate TMA block | 20 | 20 | 20 | 20 | 20 | 10 |
| Grand total cores per replicate TMA block | 146 | 146 | 146 | 146 | 146 | 730 |
| These numbers represent the number of cases selected in the original design of the TMA. Due to the non-uniformity inherent to tissue samples and histologic techniques, not all cases will be represented in all of the TMA sections. | ||||||
Annotation Data
View and Download TMA Data (Annotation Tables, Maps, Data Key)